New Store Sales Update – 2nd Year Stores
Second Year Stores Finding Sales Success
Second year stores are continuing the trend of increased new store success, achieving consistently higher sales compared to previous new stores.
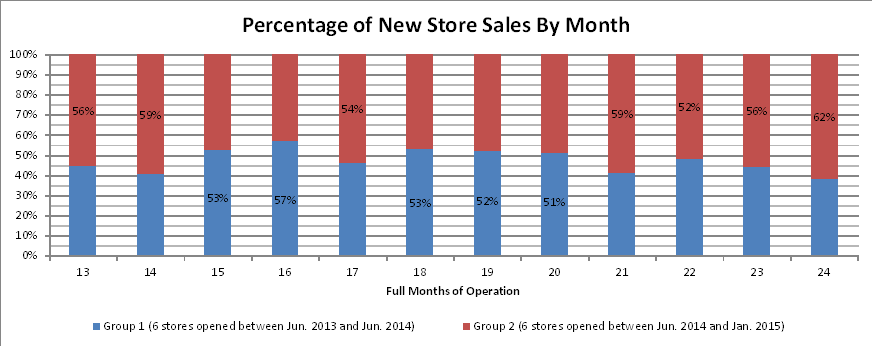
While we previously profiled the increases in first year stores for new stores grouped chronologically since June 2013, the same grouping of 6 stores opened between June 2014 and January 2015 is averaging higher monthly sales in their second year than the previous grouping in 7 of the 12 months. This newer grouping also averaged 13% higher second year total sales. The graph below illustrates the increases.
Second year invoice data also reflects the trend of faster store start-ups and sales growth. The newer grouping of stores averaged a higher invoice value in 8 of the 12 months in their second year, while also achieving a higher invoice count in 10 of the 12 months. The newest grouping averaged 24% more invoices per month, at a 19% higher average value.
While there are likely many variables contributing to these significant increases, hardworking franchisees, increased Head Office support, improved training and guidance and marketing effectiveness are certainly contributing factors to the improving new store sales.


